A paper posted this week puts KV cache reads at 82.4% of an agent's total API cost, not output tokens. Between them, two papers have now measured the three remedies engineering teams reach for first. Trimming the history to the last twelve tool rounds cost 1.85 times the full-context baseline. Summarising it saved about 7% and lost roughly five accuracy points. Compressing it cost 40.1% more than doing nothing.
The reader is whoever signs off the running cost: the IT manager, informatiemanager, IT director or security officer in a Dutch or Flemish organisation of 250 to 5,000 people, with an ICT partner in place. Crux Digits specifies and instruments AI alongside whoever runs your estate; we sell no beheer, no infrastructure, no hosting and no service desk. The question is narrow: when an agent's bill moves between two runs of the same task, where do you look first?
Where does the money in an agent run actually go?
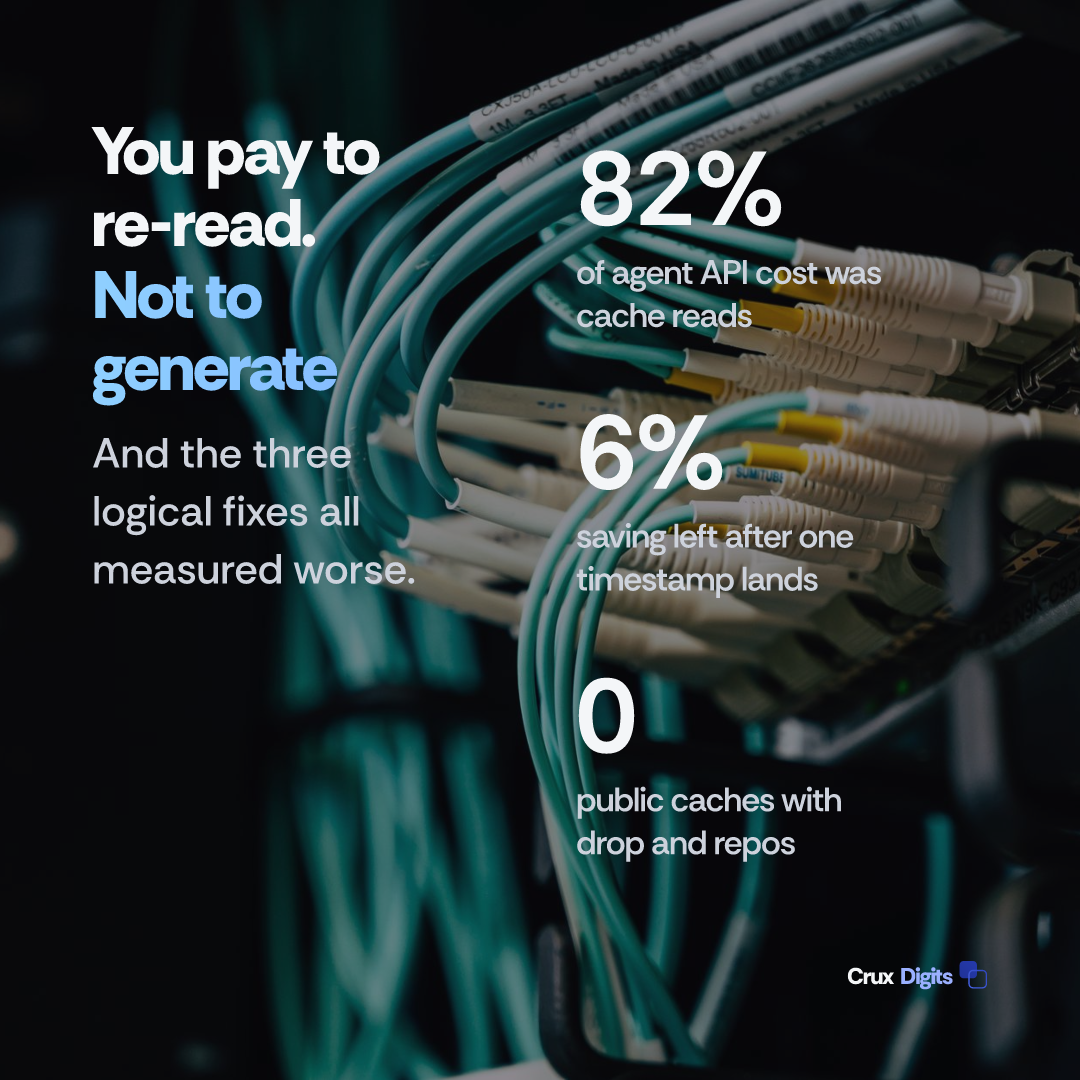
Cache Engineering for Agents, posted to arXiv on 20 October 2026 by a group led from Tsinghua University, reports that KV cache reads account for 82.4% of total API cost in its agent workloads. Read it with its basis attached: it is computed from token counts against list rates for open-weight models, not read off an Anthropic or OpenAI invoice, so the ratio shifts on an endpoint whose cache reads cost a tenth of base input or less. The direction survives, and it inverts the intuition most cost conversations run on. An agent's output per step is a few hundred tokens; its input is the entire trajectory so far, re-read on every later step. What you buy, round after round, is not generation. It is re-reading.
The paper's own fix moves the needle by about a quarter. Averaged across three models and four benchmarks, its AKV system cut cost 27.7% against Standard, which is not a full-context baseline but the threshold summariser described below, and the per-model average score edged up rather than down. A quarter off four fifths of the bill is a larger lever than most model swaps.
Why does trimming the context make the bill worse?
Because the cache is a prefix, and a prefix is reusable only up to its first edit. Change earlier trajectory text and every cached state after it is invalid, so the model re-prefills the suffix: the earlier the edit, the more there is to recompute. Trimming the history is, mechanically, an edit near the front.
The measured result is uncomfortable. Keeping only the latest twelve tool rounds cost 1.85 times the full-context baseline on GPT-OSS-120B across 100 tasks. Summarising at a 48K-token threshold cut cost by about 7% and lowered accuracy by about five points: a poor trade in both directions at once.
Compression had already been measured, and had already lost. A PayPal study from July 2026, Cache-Aware Prompt Compression, found query-aware compression the most expensive option it tested, 40.1% above an uncached, uncompressed baseline on the tau-bench retail benchmark, for exactly this reason: a query-aware compressor produces a different prefix for every query, so it defeats the cache it is meant to relieve. The same paper's query-agnostic method, which leaves the cache breakpoint intact, was cheapest in all 16 configurations it tested on LongBench-v2. Compression is not the villain. Query-dependent compression is.
That is the trap in one line: the instinct to shorten is right about tokens and wrong about money.
Which cache-breaking change will your team make by accident?
Anthropic documents the rule plainly in its prompt caching reference: the hierarchy runs tools, then system, then messages, and a change at one level invalidates that level and every level after it. Matching is exact, up to and including the block carrying the cache control. There is no partial credit.
What makes this a change-management problem rather than a coding problem is how ordinary the breaking changes look. A modelled 30-turn agent loop, priced in October 2026, saves around 80% on Claude when cached correctly; put a timestamp near the top of the system prompt and that falls to 6%. Put a volatile value inside a tool description and the same analysis measured 24% more than not caching at all, because tool definitions sit at the top of the hierarchy. Anthropic's documentation names a subtler case: Go and Swift randomise key order during JSON conversion, so a tool_use block can break the cache with no diff to review.
One placement rule belongs in a checklist: a breakpoint on a block that changes per request writes a fresh entry every time and never hits. Prefix stability is a property of your change process, not of your prompt style.
Is the cause idle sessions or tight tool loops?
Here the sources disagree, and the disagreement is the most useful thing in them. The provider story is about idleness: a session pauses, the five-minute window lapses, you pay to prefill again. Anthropic sells the remedy directly, a one-hour TTL at twice base input on write against 1.25 times for five minutes.
A simulation over real traces tells a different story. Run through a block-granular prefix-cache simulator, 68,266 requests from 393 Claude Code sessions showed a median gap of 2.1 seconds, with only 3.3% of gaps exceeding 300 seconds. Requests following gaps under ten seconds accounted for 33.1% of all recompute tokens; requests following gaps over five minutes accounted for 17.5%. A 300-second TTL policy produced byte-identical results to plain LRU in every run, which is to say the five-minute clock never fired. The misses came from capacity pressure inside tight tool loops, not from waiting.
That author is careful about the limit and so should we be: those runs are capacity-bound rather than TTL-bound, which makes them a model of self-hosted or dedicated serving, not of a provider API. The caveat is the whole point. The same symptom, cost per run jumping between identical tasks, has a different cause depending on where the agent runs, and the remedy for one cause is dead weight against another. Siddhant Khare drew that line first, in an agentic inference field guide of 18 October that splits capacity misses from retention misses on the same traces and warns that a win on one says little about the other. What his two branches leave out is the third cause, the one living in your own prompt rather than in anyone's serving tier. One caution on the trace work: the three hazard-based policies that lost to LRU there were the author's own variants, not published systems, so it is evidence that LRU is underrated, not that anything was refuted.
One caution on instrumentation, as a practitioner's impression rather than a study. In a vendor interview last June, SemiAnalysis's Doug O'Laughlin put observed physical hit rates "around the 70s", much lower on a new session, while the same piece cites logical rates of 90% or more as what multi-agent workflows can reach. Two claims about two different things, which is why you measure your own.
So where do you look first?
Three causes, three places to look, in order. On a provider API, suspect your own prefix: log cache-creation and cache-read token counts per call, and diff the system prompt and tool definitions between a cheap run and an expensive one before touching anything else.
On self-hosted or dedicated serving, suspect capacity rather than idleness: working-set size and eviction policy are the levers, and a longer TTL buys nothing against a 2.1-second median gap. If the prefix is stable and capacity is comfortable, suspect the trajectory itself and measure it: plot cost per run against tool rounds per run. A line that bends upward is the trimming trap in your own data, and its remedies are the architecture answers below, new enough that watching is defensible.
Cache operations and memory-native models: adopt now, or watch?
The architecture answers arrived in the same week, which is itself the signal. AKV proposes two operations: drop, which excludes selected cache entries from future attention while the trajectory text stays untouched, and repos, which rewrites the positions of the keys that remain. Both are needed together: position indices keep growing as a trajectory grows even after the cache shrinks, so a small cache can still hit the model's position limit. Against the summarising baseline, tool-response drop with repos raised the pass rate on one benchmark from 56% to 62% while cutting cost from 13.5 to 10.9 cents. Repos is what earns that: drop alone scored 55%.
One detail matters to anyone running a gateway or proxy: identical token sequences can produce different cache states depending on the drop history, so ordinary prefix matching can reuse the wrong state. Cache identity has to include operation history, not only text. This is a serving-engine feature, not an application one: neither Anthropic's nor OpenAI's public cache exposes anything like drop and repos, so you cannot adopt it on a provider API this quarter. What transfers is the direction. The measured policy drops the oldest tool responses, keeps the recent ones, then re-indexes what is left, which is the opposite of the prompt-text rule above and deliberately so: drop never edits the trajectory text, so it never invalidates a prefix.
The model layer moved too. MemT-1.0, posted on 19 October, builds memory into the model's own computation instead of keeping keys and values for every token, reporting roughly 66 times less persistent storage than a full-context KV cache at a 128K history. Read it as a direction, not a verdict: the abstract says only that it stays competitive with retrieval-augmented methods, and the listing carries no benchmark table. On 20 October DeepSeek open-sourced DeepInfer, the framework behind its large-scale production services, under Apache 2.0. Read its own list of what the release leaves out, though: the first item required for a complete inference service, and not included, is a KV cache system.
The product layer shipped its own answer. Notion's 19 October release raised the ceiling on a single agent task to 24 hours on a rebuilt harness, and separately reports its Auto router matching Opus 5.5 and Astra across twenty-plus common tasks at roughly 90% lower average cost. Note which lever Notion credits for the money: routing each task to an appropriately cheap model, not cache economics. Two of the three layers went after the cache this week; the one with a product to ship went after the model.
What this changes for a Dutch IT organisation
Three things, none needing a new supplier. Put cost per run on the dashboard with a P95 beside it, rather than token counts. An agent's unit cost is non-deterministic in a way a per-seat licence is not, and a contract written in seats will not model it; the agent observability argument applies to money as readily as to traces.
Add prefix stability to your change process. The timestamp case is the template: a change any reviewer waves through, with a measured cost consequence. It belongs on the same checklist as a schema migration, which puts it in the conversation with whoever runs your estate. If your agent calls tools over MCP, note that tool definitions sit at the top of the invalidation hierarchy, so a server team that edits its own tool descriptions is editing your bill.
Then settle the diagnostic fork before buying a remedy. The longer TTL, the summariser and the compression library each address a different cause, and two of the three measured worse when aimed at the wrong one. That is a cheap hour of analysis against four fifths of the bill. The broader discipline is context engineering; this week's measurements put a price on getting it wrong.
Costing an agent project from scratch is a different question, and what an AI project costs is where we answer it; applied AI for mid-sized organisations sets out how we work beside an incumbent ICT partner. What changed this week is the running cost, and that is the one that arrives every month.
A consultant tells you where AI pays off; Crux Digits also builds it. A fixed price per step, one named expert, from Utrecht.
AI consultancy in the Netherlands →