AI use rose in all twelve business sectors that Eurostat tracks between 2023 and 2025. Wholesale nearly tripled to 23.4% of EU companies with ten or more staff (Eurostat isoc_eb_ain2, updated 15 June 2026, share of enterprises, 2025), manufacturing reached 17.3% and transport and storage 11.2%. Belgium leads all of EU manufacturing at 39.8%, and the Netherlands is in the EU top six in nine of its eleven ranked sectors.
This study ranks every EU country inside every sector, for the IT manager, CIO or informatiemanager at a Dutch or Belgian organisation of 250 to 5,000 people. Crux Digits designs and builds AI systems next to an organisation's ICT partner. The analysis is ours; the numbers are Eurostat's.
How was this study built?
We ranked up to 27 member states within twelve sectors, using Eurostat table isoc_eb_ain2, last updated on 15 June 2026.
Source: the EU survey on ICT usage in enterprises, table isoc_eb_ain2, AI by NACE Rev. 2 activity. We pulled it through the Eurostat API on 28 October 2026.
Indicator: the share of enterprises using at least one AI technology (E_AI_TANY), in percent of enterprises with ten or more persons employed, for 2023, 2024 and 2025. For the four focus sectors we added three process indicators and the manufacturing branches. The 250-plus figures come from isoc_eb_ai, same update date.
Our own work: ranks, gaps to the leader in percentage points, changes since 2023, and each 2023 leader against the EU average two years later.
Flags: Eurostat publishes no value for cells marked u (low reliability). Those countries are not ranked, and we say how many of the 27 have a value. The Dutch all-sector and retail figures for 2025 carry a b (break in series), as do all Swedish values for 2023. Country profiles are in our companion studies on the Netherlands and Belgium.
Which sectors lead AI use in the EU, and who leads each one?
Information and communication leads at 62.5% of EU companies in 2025; construction is last at 10.8%.
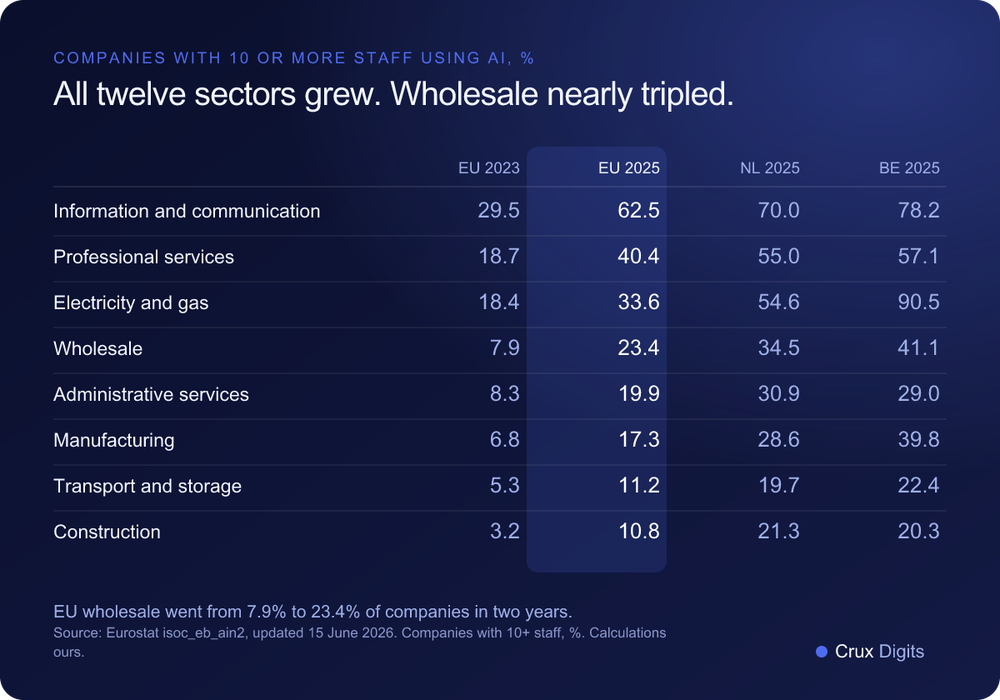
The EU27 sector league, 2025: 1. Information and communication 62.5 · 2. Professional, scientific and technical services 40.4 · 3. Electricity and gas supply 33.6 · 4. Real estate 24.8 · 5. Wholesale 23.4 · 6. Administrative and support services 19.9 · 7. Manufacturing 17.3 · 8. Retail 15.5 · 9. Water supply and waste 13.1 · 10. Accommodation and food 12.0 · 11. Transport and storage 11.2 · 12. Construction 10.8. All sectors together: 19.95.
Every sector at least doubled since 2023 except electricity and gas, which grew 1.8 times from an already high 18.4%. The steepest climbs came from the lower half: construction 3.4 times, accommodation 3.1 times, wholesale 3.0 times.
Sector leaders, with Dutch, Belgian and German ranks:
Information and communication: Sweden 87.9. Belgium 5th (78.2), Germany 6th (75.4), Netherlands 8th (70.0).
Professional services: Finland 74.8. Belgium 4th (57.1), Netherlands 5th (55.0), Germany 9th (48.3).
Electricity and gas: Belgium 90.5. Netherlands 3rd (54.6), Germany 6th (37.4).
Real estate: Sweden 56.4. Germany 4th (29.1). No Dutch or Belgian value.
Wholesale: Denmark 54.9. Belgium 3rd (41.1), Netherlands 6th (34.5), Germany 8th (32.4).
Administrative services: Finland 38.7. Netherlands 5th (30.9), Belgium 7th (29.0), Germany 11th (22.1).
Manufacturing: Belgium 39.8. Netherlands 6th (28.6), Germany 7th (24.4).
Retail: Denmark 32.1. Netherlands 3rd (27.5, b), Belgium 6th (24.5), Germany 8th (23.4).
Water and waste: Sweden 36.2. Netherlands 4th (21.4), Germany 6th (16.9). No Belgian value.
Accommodation and food: Denmark 25.2. Belgium 5th (18.5), Netherlands 8th (16.0), Germany 10th (14.6).
Transport and storage: Luxembourg 27.9. Belgium 3rd (22.4), Netherlands 5th (19.7), Germany 14th (12.2).
Construction: Finland 24.0. Netherlands 4th (21.3), Belgium 5th (20.3), Germany 10th (14.3).
All 27 countries report in seven sectors; manufacturing has 26, wholesale 25, real estate 22, water and waste 19, energy 17. The Nordics lead nine of the twelve. Belgian companies use AI more often than German ones in all ten sectors where both have a value, Dutch companies in ten of eleven, information and communication the exception.
Where are the Netherlands and Belgium furthest behind the leader?
Where 25 or more countries report, the largest Dutch opening is wholesale, 20.4 points behind Denmark; for Belgium it is professional services, 17.6 points behind Finland.
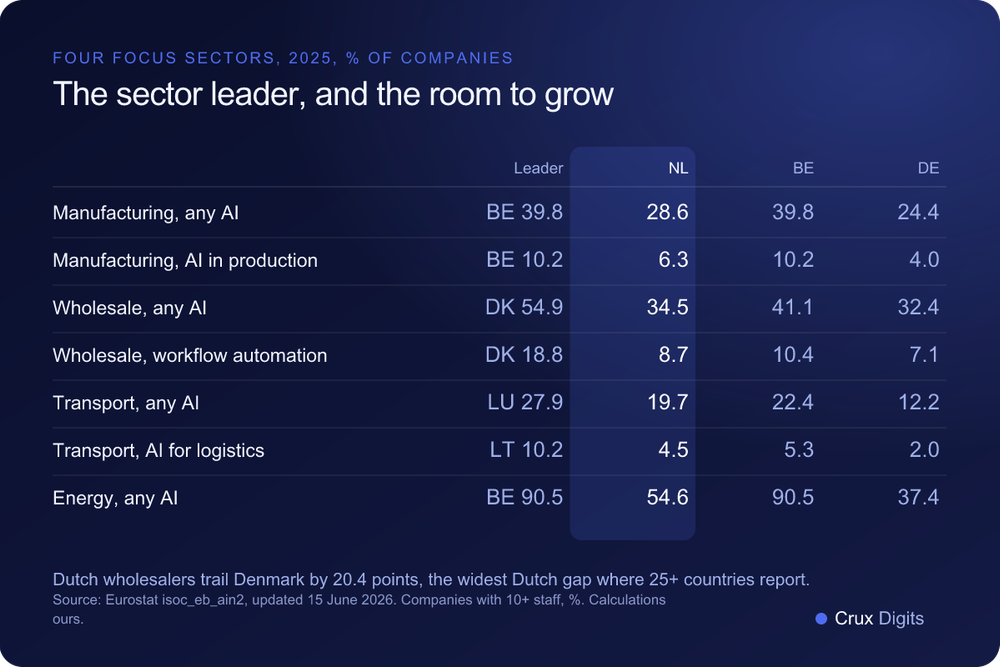
Dutch gap to the leader in percentage points, sectors where at least 25 countries report: wholesale 20.4 · professional services 19.8 · information and communication 17.9 · manufacturing 11.2 · accommodation 9.2 · transport 8.3 · administrative services 7.8 · retail 4.7 · construction 2.7. Where fewer countries report, the gap is wider: energy, 35.9 behind Belgium and 21.3 behind Slovenia, and water and waste, 14.7 behind Sweden.
Belgian gap: professional services 17.6 · wholesale 13.8 · information and communication 9.7 · administrative services 9.7 · retail 7.7 · accommodation 6.8 · transport 5.5 · construction 3.8. In manufacturing and energy Belgium is the leader.
As plain arithmetic, closing half the Dutch wholesale gap would put Dutch wholesalers at about 44.7%, above Belgium today.
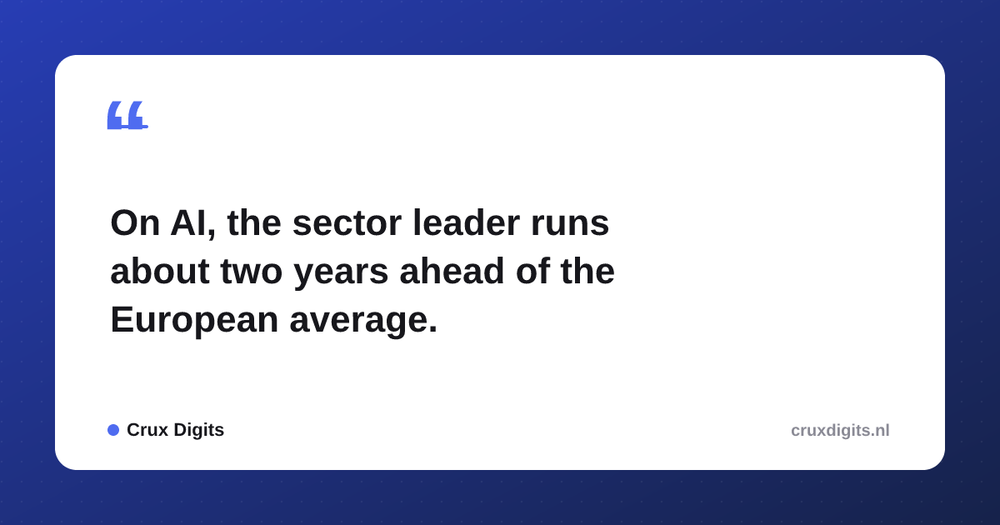
Rule of thumb: in eight of the twelve sectors, the 2025 EU average had already passed the level the leading country reached in 2023. Luxembourg led manufacturing at 16.2% in 2023; the EU is now at 17.3%. Slovenia led wholesale at 17.2%; the EU is at 23.4%. On this survey, the sector leader has run about two years ahead of Europe. The exceptions are energy, water and waste, retail and transport, where the 2023 leaders were further ahead.
How far has AI reached into manufacturing?
In 2025, 17.3% of EU manufacturers used AI. Belgium leads 26 countries at 39.8%, the Netherlands is sixth at 28.6% and Germany seventh at 24.4%.
The manufacturing league in rank order: Belgium 39.8, Denmark 38.6, Luxembourg 37.6, Sweden 32.9, Austria 32.5, Netherlands 28.6, Germany 24.4, Slovenia 22.7, Estonia 22.7, Lithuania 19.2, Ireland 17.7, Malta 17.6, Spain 17.1, France 16.9, Czechia 16.7, Slovakia 15.8, Italy 14.7, Croatia 12.9, Latvia 12.4, Portugal 9.9, Hungary 7.8, Greece 7.8, Poland 7.7, Bulgaria 5.3, Cyprus 4.3, Romania 3.2. Finland: not published (u).
The EU figure rose from 6.8% in 2023. Sweden gained 25.4 points (2023 value flagged b), Belgium 24.5, the Netherlands 16.8, Germany 15.1.
The line a plant manager cares about is AI in production processes: 3.5% of EU manufacturers, about one in five of those using AI at all. Belgium leads at 10.2%, the Netherlands is sixth at 6.3%, Germany 14th at 4.0%. In machine learning the Netherlands is third at 7.4%, against an EU 3.7%. That is the difference between an assistant drafting the 8D report and a model reading the historian and SCADA tags to flag a bearing before it fails. The second is where the room is.
By branch, Dutch manufacturers sit near the top: machinery 40.1% (4th of 20), chemicals 37.4% (3rd of 19), rubber and plastics 31.8% (2nd of 22), metals 27.4% (4th of 26), food 22.6% (4th of 24), pharmaceuticals 48.9% (3rd of 18, Belgium 4th at 48.5). The exception is vehicles: 23.1%, 7th of 18, where Germany is 3rd at 30.9.
Dutch food and beverage manufacturers rank first of 24 for AI in logistics, 4.4% against an EU 0.8%, and first for autonomous machines, 4.5% against 1.0%. Dutch machine builders are second of 21 for machine learning, 13.9% against 6.4%.
Why does transport and logistics trail, and who is pulling ahead?
Transport and storage gained 5.9 points between 2023 and 2025, the smallest rise of the twelve sectors, reaching 11.2% of EU firms.
The transport and storage league in rank order: Luxembourg 27.9, Denmark 26.9, Belgium 22.4, Lithuania 20.0, Netherlands 19.7, Austria 19.4, Malta 18.6, Ireland 16.8, Slovakia 15.8, Portugal 14.8, Spain 14.7, Estonia 14.0, Finland 12.9, Germany 12.2, Sweden 12.2, Italy 11.6, Greece 9.6, France 9.0, Slovenia 8.5, Czechia 6.1, Latvia 5.9, Hungary 5.9, Bulgaria 5.7, Cyprus 5.5, Croatia 4.8, Romania 3.1, Poland 3.0.
The Low Countries are pulling ahead. Dutch transport and storage rose 8.7 points in a single year, from 11.0% in 2024 to 19.7%. Belgium is third at 22.4%, level with 2024: twice the EU rate, with the Netherlands at 1.8 times. Luxembourg gained most since 2023, 17.9 points.
The core process is where the opening sits. Only 2.1% of EU transport firms use AI for logistics, about one in five of those using AI. Lithuania leads at 10.2%, Belgium is fourth of 26 at 5.3%, the Netherlands fifth at 4.5%, Germany 17th at 2.0%. For workflow automation: EU 2.8%, Denmark 14.0%, Belgium 9.8%, the Netherlands 5.3%.
In a carrier or a warehouse that means planning in the TMS, slot booking at the dock, ETA prediction, and reading CMRs and delivery notes into the WMS without retyping.
Where do wholesale and energy stand?
Wholesale nearly tripled, from 7.9% to 23.4% of EU firms; energy is the third most AI-intensive sector at 33.6%.
The wholesale league in rank order: Denmark 54.9, Sweden 46.9, Belgium 41.1, Austria 38.2, Slovenia 35.1, Netherlands 34.5, Luxembourg 34.3, Germany 32.4, Czechia 24.2, Lithuania 21.4, Estonia 21.3, Croatia 20.9, Spain 20.9, Ireland 19.2, France 18.8, Slovakia 17.2, Malta 15.4, Hungary 14.2, Latvia 13.1, Greece 11.6, Poland 11.2, Bulgaria 8.9, Portugal 8.6, Romania 6.7, Cyprus 5.2. Italy and Finland: not published (u).
Denmark gained 37.9 points since 2023 and Belgium 27.1; the Netherlands added 22.7 and Germany 19.3. For workflow automation, Danish wholesalers are at 18.8%, Belgium 10.4%, the Netherlands 8.7%, the EU 5.6%. In a wholesaler that is order intake from e-mail and EDI straight into the ERP, a forecast on the order lines, price list updates, and matching pakbon to invoice.
The energy league, electricity and gas supply, in rank order: Belgium 90.5, Slovenia 75.9, Netherlands 54.6, Sweden 53.4, Malta 50.0, Germany 37.4, Ireland 35.1, Estonia 24.7, Portugal 20.4, Hungary 19.9, Greece 16.5, Poland 16.2, Latvia 15.5, Slovakia 13.2, Czechia 13.0, Romania 6.5, Bulgaria 5.6. Ten countries: not published.
Belgium's 90.5% rests on few companies and has no published 2023 or 2024 value, so read it with care. Dutch energy companies were early: 47.9% used AI in 2023, when the EU stood at 18.4%. Today they rank fourth of 20 for machine learning at 29.0% (EU 13.1%) and third of 17 for workflow automation at 24.2% (EU 14.9%). The vocabulary here is grid congestion forecasts, meter data, asset inspection and outage planning.
What does this mean for an IT manager or CIO at a 250 to 5,000 FTE organisation?
Treat your sector's rate as a floor: 55.0% of EU firms with 250 or more staff used AI in 2025, against 19.95% across all sizes.
The 250-plus figure is 67.6% in the Netherlands, 76.4% in Belgium and 57.0% in Germany. A large organisation at its sector average is behind its own size class.
A rule of thumb on one line: the sector rate is your floor, your country's 250-plus rate is your peer group, and the sector leader is roughly where the EU average stood two years later.
Benchmark on the process line, not the headline: AI in production processes for a manufacturer, AI for logistics in transport, workflow automation for a wholesaler. On those lines the leading country stands at three to five times the EU rate, and one system in production puts an organisation in the leading group.
What are the limits of this data?
Finance, health, education and public administration are outside the survey, as are agriculture and mining, so nothing here describes a bank, an insurer, a hospital, a school or a municipality.
This table counts companies with ten or more persons employed and has no size split by sector. Energy, water and waste and real estate rest on few companies per country, and most Belgian manufacturing branches are not published for 2025.
The definition widened. In 2025 Eurostat's 'at least one AI technology' includes an eighth technology, generating pictures, video or sound, which has values only for 2025 (9.6% of EU companies). Part of the 2024 to 2025 rise may come from that; Eurostat flags no break for the EU aggregate.
Use is self-reported and binary: one pilot and a company-wide system count the same. The figures are national, with no split for Flanders, Wallonia or Brussels.
The short version
1. All twelve EU business sectors raised their AI use between 2023 and 2025, and wholesale nearly tripled, from 7.9% to 23.4% of companies.
2. Belgium leads EU manufacturing at 39.8% of firms, first of 26 countries, and also leads AI in production processes at 10.2%.
3. Wholesale is the widest Dutch gap where 25 or more countries report: Dutch wholesalers are at 34.5%, 20.4 points behind Denmark.
4. Dutch transport and storage firms went from 11.0% to 19.7% in one year, 1.8 times the EU rate in Europe's slowest-growing sector.
5. In eight of twelve sectors the 2025 EU average had passed the level the leading country reached in 2023, so sector leaders run about two years ahead.
Where Crux Digits fits: we design and build the AI system for one process, next to the ICT partner or IT team you already have, and hand over code you own. We are not an ICT partner and do not run infrastructure. The approach for mid-sized organisations: applied AI and machine learning for mid-sized businesses.
Last updated: 28 October 2026.
A consultant tells you where AI pays off; Crux Digits also builds it. A fixed price per step, one named expert, from Utrecht.
AI consultancy in the Netherlands →