The EU's computer consultancy firms turned over €331.0 billion in 2024 (Eurostat sbs_ovw_act, updated 30 September 2026), 40.9% more than in 2021. The Netherlands earns more per person than most: €227.7 thousand of turnover per person employed, sixth of 27 member states and up from eighth in 2021. It does so with some of the smallest firms in Europe, 2.53 persons per firm against 8.19 in Germany.
We pulled Eurostat's business statistics for computer and management consultancy in all 27 member states, added CBS register counts, and computed the ranks and changes ourselves. This is for the IT manager, CIO or informatiemanager at a Dutch or Flemish organisation of 250 to 5,000 people who buys AI consultancy. Crux Digits is one of those suppliers: an AI partner next to your ICT partner, not in place of it.
How was this study built?
Two Eurostat tables, one CBS table and our arithmetic, pulled via the public APIs on 28 October 2026.
Eurostat sbs_ovw_act, enterprises by detailed NACE Rev. 2 activity, last updated 30 September 2026: enterprises, persons employed, net turnover (million euro) and net turnover per person employed (thousand euro), 2021 to 2024.
Eurostat sbs_sc_ovw, the same statistics by size class, updated the same day. The size split is published at three-digit level, as the SBS metadata explain, so for IT it covers all of division J62: programming, consultancy, facilities management and other IT services.
Activities: NACE J62.02, computer consultancy, and M70.2, management consultancy. Persons employed are employees plus self-employed persons, counted as heads. Turnover is in current euro.
CBS StatLine 81589NED, Bedrijven; bedrijfstak, updated 15 October 2026: Dutch businesses in SBI 6202 (IT consultancy) and 7022 (organisatieadviesbureaus) by size, quarterly to 1 October 2026; 2025 and 2026 are provisional.
Our own work: persons per enterprise to two decimals (Eurostat rounds it to whole numbers), the ranks, the changes since 2021, the size-class shares, and real changes deflated with Eurostat's consumer price index prc_hicp_aind, updated 6 February 2026.
Flags: seven countries (Spain, France, Luxembourg, Austria, Portugal, Romania, Finland) carry a break in series (b) for 2021. Finland's 2024 management consultancy employment and turnover are confidential (c), so 26 countries are ranked there. EU27 management consultancy totals for 2023 and 2024 are estimates (e). The Netherlands, Belgium and Germany carry no flags.
How big is the EU consultancy market and how fast did it grow?
About €661 billion of turnover in 2024: €331.0 billion in computer consultancy and an estimated €330 billion (e) in management consultancy.
Computer consultancy in the EU: 359,552 enterprises and 1,695,150 persons employed. Turnover grew 40.9% from 2021 to 2024, employment 16.7%. Management consultancy: 1,210,334 enterprises and about 2.1 million persons employed (e), with turnover up an estimated 35.2%.
Netherlands, computer consultancy: 36,402 enterprises, 92,007 persons employed, €20.95 billion turnover, up 53.0% since 2021. That is the fifth largest market in the EU by turnover, after France, Germany, Ireland and Spain. Management consultancy: 180,168 enterprises, 193,013 persons, €29.45 billion, up 34.7%.
Belgium: 24,380 computer consultancy enterprises with 75,093 persons and €16.92 billion (up 25.8%); 76,194 management consultancies with €23.00 billion. Germany: 36,192 computer consultancy enterprises with 296,372 persons and €61.26 billion (up 27.7%); 89,516 management consultancies with €55.08 billion.
Dutch computer consultancy grew its turnover almost twice as fast as Germany's and Belgium's over the same three years. These are nominal figures: consumer prices rose 19.9% in the Netherlands, 17.7% in Belgium and 18.1% in Germany between 2021 and 2024.
How fragmented are the Dutch and Belgian consultancy markets?
Very: the average Dutch computer consultancy has 2.53 persons employed, 21st of 27, and the average Dutch management consultancy 1.07, the lowest of the 26 countries with a value.
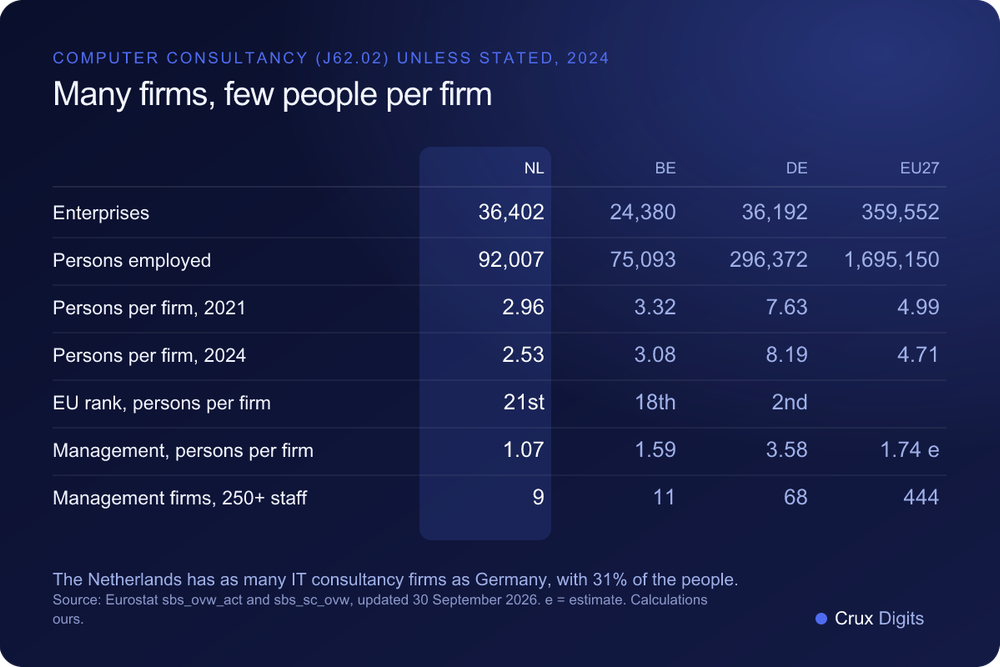
Computer consultancy, persons employed per enterprise, 2024: 1. Spain 10.61; 2. Germany 8.19; 3. Portugal 6.49; 4. Ireland 6.45; 5. Bulgaria 6.14; 6. France 6.04; 7. Sweden 4.70; 8. Denmark 4.36; 9. Italy 4.18; 10. Cyprus 3.83; 11. Finland 3.68; 12. Hungary 3.67; 13. Lithuania 3.64; 14. Austria 3.53; 15. Luxembourg 3.41; 16. Slovenia 3.14; 17. Greece 3.08; 18. Belgium 3.08; 19. Romania 2.78; 20. Malta 2.72; 21. Netherlands 2.53; 22. Latvia 2.50; 23. Croatia 2.44; 24. Poland 2.14; 25. Czechia 1.95; 26. Slovakia 1.53; 27. Estonia 1.48. EU27: 4.71.
Management consultancy, persons employed per enterprise, 2024 (26 countries; Finland confidential): 1. Spain 4.52; 2. Germany 3.58; 3. Ireland 3.55; 4. Greece 2.87; 5. Portugal 2.83; 6. Cyprus 2.30; 7. Austria 2.23; 8. Denmark 2.18; 9. Romania 2.11; 10. Italy 2.09; 11. Malta 2.07; 12. Bulgaria 2.01; 13. Poland 2.01; 14. Lithuania 1.97; 15. Hungary 1.88; 16. Latvia 1.88; 17. Slovakia 1.82; 18. Croatia 1.61; 19. Belgium 1.59; 20. Luxembourg 1.46; 21. Czechia 1.28; 22. Estonia 1.26; 23. Sweden 1.24; 24. Slovenia 1.23; 25. France 1.10; 26. Netherlands 1.07. EU27: 1.74 (e).
Against Germany: the Netherlands has as many computer consultancy firms as Germany, 36,402 against 36,192, with 31% of the people. In management consultancy it has twice as many firms, 180,168 against 89,516, with 60% of the people.
The Dutch market grew by adding firms. From 2021 to 2024 the number of Dutch computer consultancy firms rose 39.0% and the number of persons employed 18.6%, so the average firm went from 2.96 to 2.53 persons. In Germany the number of firms fell 0.3% while employment rose 7.1%, and the average firm grew from 7.63 to 8.19. Belgium moved from 3.32 to 3.08.
Which EU countries earn the most per consultant?
Ireland, Luxembourg and Malta lead computer consultancy turnover per person employed; the Netherlands is sixth at €227.7 thousand and Belgium seventh at €225.3 thousand, both above the EU's €195.3 thousand.
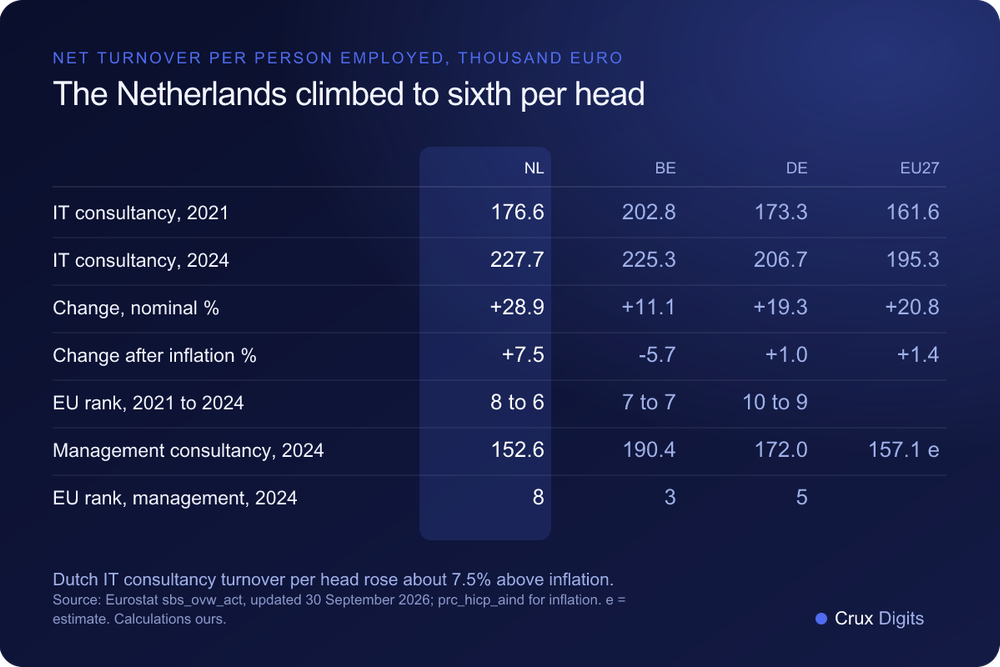
Computer consultancy, net turnover per person employed, thousand euro, 2024: 1. Ireland 1,336.0; 2. Luxembourg 445.1; 3. Malta 305.7; 4. Sweden 267.7; 5. Finland 236.7; 6. Netherlands 227.7; 7. Belgium 225.3; 8. Denmark 215.8; 9. Germany 206.7; 10. France 192.5; 11. Austria 185.4; 12. Czechia 160.4; 13. Slovenia 156.1; 14. Italy 132.9; 15. Cyprus 128.7; 16. Estonia 106.0; 17. Hungary 105.9; 18. Spain 105.7; 19. Greece 105.6; 20. Poland 99.3; 21. Slovakia 93.1; 22. Lithuania 86.8; 23. Portugal 83.8; 24. Latvia 79.7; 25. Bulgaria 76.0; 26. Romania 71.7; 27. Croatia 70.8. EU27: 195.3.
Ireland's figure is 6.8 times the EU value and says little about a typical firm; read the table from second place down.
The Dutch figure is the one that moved most among our three markets. Turnover per person in Dutch computer consultancy rose 28.9%, from €176.6 thousand in 2021 to €227.7 thousand in 2024, and the Netherlands climbed from eighth to sixth. Deflated with the Dutch consumer price index, that is a real gain of about 7.5%. Germany's 19.3% rise is about 1.0% in real terms and the EU's 20.8% about 1.4%. Belgium's 11.1% rise stayed below its 17.7% inflation, a real change of about minus 5.7%, while it held seventh place.
Management consultancy, net turnover per person employed, thousand euro, 2024 (26 countries): 1. Ireland 803.3; 2. Luxembourg 284.9; 3. Belgium 190.4; 4. Denmark 186.5; 5. Germany 172.0; 6. France 164.4; 7. Sweden 161.6; 8. Netherlands 152.6; 9. Italy 143.5; 10. Austria 140.0; 11. Malta 132.5; 12. Slovakia 117.8; 13. Czechia 117.6; 14. Spain 116.4; 15. Poland 94.9; 16. Cyprus 79.6; 17. Estonia 77.9; 18. Greece 75.1; 19. Slovenia 75.0; 20. Romania 70.7; 21. Portugal 70.3; 22. Lithuania 65.1; 23. Hungary 62.8; 24. Bulgaria 59.8; 25. Latvia 59.1; 26. Croatia 58.4. EU27: 157.1 (e).
Belgium is the standout here: third in the EU, up from fourth in 2021, behind only Ireland and Luxembourg. Germany rose from eighth to fifth and the Netherlands from tenth to eighth.
How many large consultancies do the Netherlands and Belgium have?
Few: in 2024 the Netherlands had nine management consultancies with 250 or more persons employed and Belgium eleven, against 68 in Germany and 444 in the EU.
Those nine Dutch firms hold 4.9% of the sector's employment and 7.8% of its turnover. In Belgium the eleven hold 9.0% of employment and 11.5% of turnover. In Germany the 68 hold 23.4% and 35.7%, and across the EU the largest firms take an estimated 22.7% of management consultancy turnover. At the other end, 92.7% of Dutch management consultancies have zero or one person employed, and those firms hold 56.8% of the sector's employment: third of 25 countries with a value, after Estonia and Slovenia. Belgium follows at 52.9%; Germany is at 11.4%.
In IT services as a whole (division J62), the Netherlands had 105 firms of 250 or more, holding 29.0% of employment and 37.0% of turnover. Belgium had 48, with 25.6% and 33.6%. Germany had 474, with 40.7% and 56.2%. Large firms gained share in both countries: in Germany from 36.9% of employment in 2021 to 40.7%, in the Netherlands from 25.9% to 29.0%.
Size raises turnover per head, though not everywhere. Dutch IT services firms of 250 or more turn over €312.0 thousand per person, against €179.1 thousand under ten. In Belgian management consultancy, firms of 10 to 249 people turn over €270 to €274 thousand per person, more than the largest at €243.8 thousand.
CBS has the more recent Dutch count. On 1 October 2026 the register held 36,680 IT consultancy businesses (SBI 6202), 60.9% more than on 1 January 2021; 89.9% were one-person businesses, up from 85.8%, 205 had 50 or more persons employed and 100 had 100 or more. Organisatieadviesbureaus (SBI 7022) numbered 154,920: 93.3% one-person, 45 with 100 or more. CBS counts businesses, not Eurostat enterprises, so we do not mix the totals.
What does this mean for a CIO buying AI consultancy?
It means a large, growing pool of specialists, most of them in firms of one to nine people, with a short list of large firms beside it.
A rule of thumb from the data: a supplier with three people is already larger than the average Dutch computer consultancy, and a supplier with 50 or more is among the largest 0.6% of Dutch IT consultancy businesses (205 of 36,680, CBS, October 2026). Fewer than 1 in 1,000 Dutch management consultancies has 50 or more persons employed: 164 of 180,168 in 2024.
For an organisation of 250 to 5,000 FTE that is good news with one condition. The specialist depth an AI project needs is available, often in firms small enough that the person who scopes the work also builds it. The condition: your contract, not the supplier's size, carries the continuity.
Keep the work in your hands: code in your repository, infrastructure in your tenant, documentation and a runbook in every phase.
Give your ICT partner a defined role: hosting, identity, network and patching stay where they are, the AI supplier designs, builds and evidences. Put that seam in the RACI before the first sprint.
Fit the procurement to the market. A framework that only firms of 250 or more can bid on reaches 105 Dutch IT services firms. Scoped, fixed-price phases reach the rest.
Ask who does the work. With an average of 2.53 persons per Dutch computer consultancy, the named people are the firm. For the demand side over the same years, see our study of AI adoption in Dutch companies.
What are the limits of this data?
It describes the supplier market, not the AI part of it. NACE J62.02 counts every firm whose main activity is computer consultancy, and there is no AI split. A firm is classified by its main activity only.
Persons employed are heads, including self-employed owners, not FTE. A part-time freelancer and a full-time consultant count the same.
Turnover is in current euro; deflating with consumer prices is an approximation.
For IT, the size split covers all of division J62. Breaks in series affect seven countries' changes since 2021.
CBS notes that from the fourth quarter of 2023 many financial holdings were reclassified, mainly into SBI 7010 and 7022, which raises the 7022 count from then on.
Many one-person firms will work through larger ones; the statistics do not show who subcontracts to whom.
The short version
1. The Netherlands ranks sixth of 27 EU countries on computer consultancy turnover per person employed, €227.7 thousand in 2024, up from eighth in 2021 and about 7.5% above inflation.
2. Dutch computer consultancy turnover grew 53.0% from 2021 to 2024, almost twice as fast as Germany (27.7%) and Belgium (25.8%).
3. The Netherlands has as many computer consultancy firms as Germany, 36,402 against 36,192, with less than a third of the people.
4. The average Dutch computer consultancy has 2.53 persons employed, against 8.19 in Germany and 4.71 in the EU, and fewer than 1 in 1,000 Dutch management consultancies has 50 or more.
5. Belgium has the third highest management consultancy turnover per person in the EU, €190.4 thousand, behind only Ireland and Luxembourg.
Crux Digits is a small specialist by these numbers too. We design and build AI systems and the software around them, next to your ICT partner or internal IT team, and we hand over code you own. We do not run infrastructure, hosting or a helpdesk. What AI consultancy costs in the Netherlands, and how the fixed-price phases are built, is set out on AI consultancy pricing in the Netherlands.
Last updated: 28 October 2026.
A consultant tells you where AI pays off; Crux Digits also builds it. A fixed price per step, one named expert, from Utrecht.
AI consultancy in the Netherlands →