In 2024 a person working in Dutch software development produced €108,440 of value added, sixth in the EU and 34.3% above the EU figure of €80,720. Belgium did better still: €140,060, fourth. Dutch productivity rose 22.1% between 2021 and 2024 while personnel cost per employee rose 17.6%, so Dutch software firms became more productive faster than they became more expensive. Nearshore costs are catching up: Polish personnel cost per employee went from 49.7% of the Dutch level in 2021 to 63.1% in 2024.
We built this league table from Eurostat's structural business statistics and computed every rank, ratio and change ourselves. It is written for the IT manager, IT director or CIO at a Dutch or Flemish organisation of 250 to 5,000 people who decides where software gets built. Crux Digits designs and builds AI systems and the software around them, alongside the customer's ICT partner. We are not an ICT partner.
How was this study built?
The source is Eurostat's table sbs_ovw_act, enterprise statistics by detailed NACE activity, last updated on 30 September 2026 and pulled through the Eurostat API on 28 October 2026.
- Activity and years: NACE Rev. 2 class 62.01, computer programming activities (writing, modifying, testing and supporting software), 2021 to 2024. Software publishing (58.2) is too small to rank in several member states, with 437 persons employed in the Netherlands, so it is left out.
- Indicators: value added at factor cost per person employed, personnel costs per employee and per hour worked, and counts of enterprises, persons employed, turnover and value added.
- Our own work: ranks across the 27 member states, value added per euro of personnel cost (Eurostat's wage-adjusted labour productivity divided by 100), cost and productivity as a share of the Dutch level, changes since 2021, and one labelled linear extrapolation.
- Second sources: sbs_sc_ovw for value added per person by company size in division 62 (updated 30 September 2026) and isoc_eb_ain2 for AI use in NACE 62 and 63 (updated 15 June 2026).
- Flags: all 27 member states have a 2024 value for the league indicators. Austria, Spain, Finland, France, Portugal and Romania carry a break in series (b) on some 2021 values; French hourly figures for 2024 are estimates (e).
How big is the EU software development industry, and how fast is it growing?
It grew by over a sixth in three years: 2,116,502 people worked in EU computer programming in 2024, up 16.9% from 1,809,998 in 2021.
Net turnover rose from €278.1 billion to €370.3 billion (+33.2%) and value added from €132.3 billion to €170.9 billion (+29.1%). Enterprises went from 410,901 to 534,709, most of them very small: 4.0 persons employed per enterprise across the EU.
Germany is the largest market with 472,300 persons employed, 22.3% of the EU total, followed by Poland with 264,539 (12.5%). The Netherlands has 148,142 persons employed in 46,621 enterprises and €16.1 billion value added, up 33.6% since 2021. Belgium has 36,979 persons employed and €5.2 billion value added, up 46.1%.
Which EU countries produce the most value added per software worker?
Malta, Ireland and Sweden lead; Belgium is fourth with €140,060 per person employed and the Netherlands sixth with €108,440 (2024).
Value added per person employed in NACE 62.01, 2024, thousand euro: 1. Malta 248.6 · 2. Ireland 236.0 · 3. Sweden 144.1 · 4. Belgium 140.1 · 5. Cyprus 118.6 · 6. Netherlands 108.4 · 7. Luxembourg 107.2 · 8. Germany 94.7 · 9. Denmark 92.8 · 10. Austria 86.6 · 11. Finland 83.9 · 12. Spain 79.6 · 13. Italy 78.4 · 14. Estonia 70.5 · 15. France 67.8 · 16. Slovenia 67.5 · 17. Czechia 64.3 · 18. Bulgaria 59.7 · 19. Portugal 57.4 · 20. Lithuania 54.6 · 21. Romania 54.1 · 22. Latvia 54.1 · 23. Greece 48.4 · 24. Slovakia 47.5 · 25. Croatia 47.5 · 26. Hungary 46.5 · 27. Poland 38.0. EU27: 80.7.
In small economies with large international groups, value added can reflect where profits are booked, so read Malta, Ireland and Cyprus with care. Among the other 24, Sweden, Belgium and the Netherlands are the top three.
Against Germany, a person in Dutch software development produced 14.5% more value added than one in Germany in 2024, while personnel cost per Dutch employee was 3.1% lower. German productivity barely moved between 2021 and 2024 (+0.6%).
Size matters most in nearshore countries. In division 62, Polish firms with 250 or more persons employed produced €61,360 per person, against €21,340 in firms with fewer than ten. Large Dutch firms produced €126,380, Belgian €146,180, German €113,780.
Which countries give the most value added per euro of personnel cost?
After Malta, Ireland and Cyprus, Sweden (1.47) and Belgium (1.41) lead; the Netherlands is tenth at 1.28 and Poland last at 0.71 (2024).
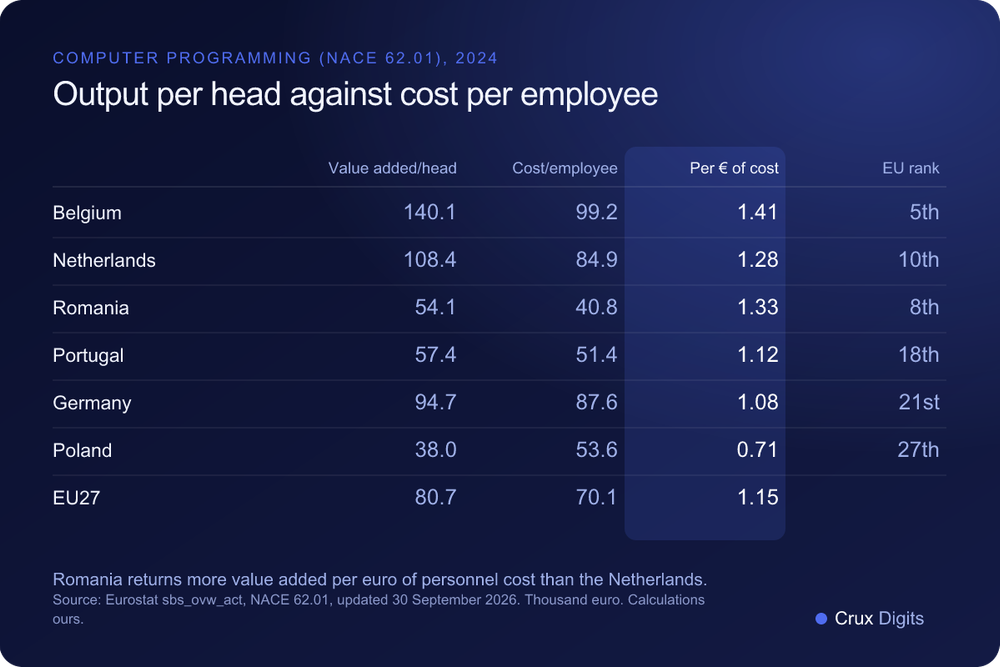
This league explains the onshore versus nearshore choice. It divides value added per person employed by personnel cost per employee.
Value added per euro of personnel cost, NACE 62.01, 2024: 1. Malta 4.77 · 2. Ireland 2.27 · 3. Cyprus 2.13 · 4. Sweden 1.47 · 5. Belgium 1.41 · 6. Italy 1.38 · 7. Spain 1.33 · 8. Romania 1.33 · 9. Croatia 1.29 · 10. Netherlands 1.28 · 11. Bulgaria 1.27 · 12. Latvia 1.26 · 13. Slovenia 1.23 · 14. Estonia 1.20 · 15. Luxembourg 1.16 · 16. Hungary 1.16 · 17. Czechia 1.12 · 18. Portugal 1.12 · 19. Greece 1.12 · 20. Lithuania 1.09 · 21. Germany 1.08 · 22. Slovakia 1.08 · 23. Finland 1.03 · 24. Austria 1.01 · 25. Denmark 0.99 · 26. France 0.85 · 27. Poland 0.71. EU27: 1.15.
Cost alone ranks differently. Personnel cost per employee was highest in Ireland (€103,860), Belgium (€99,150) and Sweden (€97,720) and lowest in Croatia (€36,690), Hungary (€40,040) and Romania (€40,810). Germany is sixth at €87,610, the Netherlands eighth at €84,900, Poland €53,550, Portugal €51,350, EU €70,060. Per hour worked by employees it was €53.49 in the Netherlands, €31.20 in Poland and €21.93 in Romania.
The surprise is Romania. Its lower personnel cost is matched almost exactly by lower value added per head, so per euro of value added Romanian staff cost 0.96 times the Dutch level per person employed and 1.02 times per employee FTE. Belgium comes out at 0.90 and Germany at 1.18. The rule of thumb for any pair of countries: divide the cost ratio by the productivity ratio. Below 1, the other country is less expensive per unit of output; above 1, it is more expensive, whatever the hourly gap says.
Is the nearshore cost gap closing?
Yes, fastest for Poland: Polish personnel cost per employee rose 49.3% from 2021 to 2024, from 49.7% to 63.1% of the Dutch level.
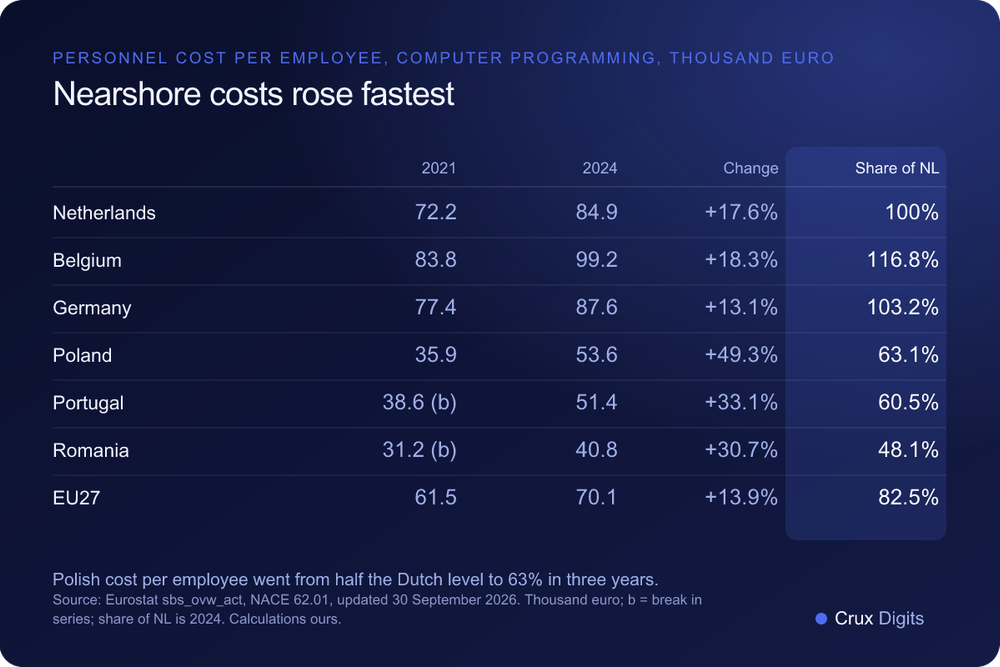
Over the same years cost per employee rose 17.6% in the Netherlands, 18.3% in Belgium, 13.1% in Germany and 13.9% across the EU, and 33.1% in Portugal and 30.7% in Romania (both from a 2021 value flagged b). Compounded, that is 14.3% a year in Poland against 5.5% in the Netherlands. Polish personnel cost per hour went from €20.86 to €31.20.
Productivity is more encouraging for two of the three. Polish value added per person stayed at about 35% of the Dutch level. Romania moved from 44.5% to 49.9% and Portugal from 48.8% to 52.9%. Between 2022 and 2024, free of break flags, Portuguese productivity rose 26.2% against cost growth of 14.0%, and Romanian productivity 22.1% against 19.6%: both are getting more productive faster than they get more expensive.
Poland's workforce is changing shape too: the share of persons employed who are not employees rose from 42.6% to 51.8%, the highest in the EU. In the Netherlands it is 11.3%.
A labelled extrapolation, not a forecast: if Polish cost per employee keeps closing on the Dutch level at the 2022 to 2024 pace of 4.96 points a year, it reaches 78.0% of the Dutch level in 2027. The same arithmetic gives 51.9% for Romania and 61.0% for Portugal.
Do software industries that use more AI produce more value added?
They tend to: across the 24 member states with published values, the rank correlation between AI use in software and IT service firms in 2025 and value added per person in 2024 is 0.56.
AI use among enterprises with ten or more persons employed in NACE 62 and 63 rose from 28.2% in 2021 to 65.7% in 2025 across the EU. Firms using AI to generate text, speech or code went from 6.7% to 45.5%. The Netherlands went from 34.3% to 71.5%, ninth of 24, with text and code generation up from 10.0% to 52.7%. Germany is fourth at 78.2%, Poland 23rd at 42.0% and Romania 24th at 34.2%. Belgium, Finland and France have no published 2025 value (flagged u).
Leaving out Malta, Ireland, Cyprus and Luxembourg, the correlation rises to 0.72 across 20 countries. Correlation does not show that AI raises productivity; productive firms may adopt AI sooner. For a buyer both readings point the same way: the industries that produce most per head adopt AI fastest. Our study on AI adoption in the Netherlands covers the wider economy.
What does this mean for an IT manager or CIO choosing onshore or nearshore?
Compare cost per unit of output, not cost per hour: the hourly cost gap between Poland and the Netherlands is 41.7%, while per euro of value added it disappears.
Per euro of value added, Polish software personnel cost is at best level with the Dutch figure (0.98 per employee FTE) and at worst 1.80 times it (per person employed). The truth sits between the two, because many Polish developers are self-employed. Four practical readings:
- Benchmark with the rule of thumb. Romania, Portugal and Belgium come out close to the Netherlands or better per unit of output. Germany does not, and Poland only does on the most favourable basis.
- Price the third year, not the first. A nearshore price set today rests on a cost base that grew 14.3% a year in Poland, against 5.5% in the Netherlands. Put indexation in the contract.
- Benchmark against the right size class. Large Polish firms produce close to three times the value added per person of micro firms, so for a 250 to 5,000 FTE organisation the large-firm figure is the relevant one.
- Ask how the supplier uses AI in delivery. Dutch software firms lead Polish ones on AI use by 29.5 points, and a supplier that generates and tests code with AI moves the productivity side of the ratio in your favour.
Our reading, not Eurostat's: integration with AFAS, Exact or SAP, the change process and the audit trail stay close to the organisation, and there an onshore productivity lead earns its cost. For Flemish readers the picture is brighter still: Belgian software firms produce 29.2% more per person than Dutch ones at 16.8% higher cost per employee, so per unit of output Belgium is 10% less expensive than the Netherlands.
What are the limits of this data?
- Value added per person is not a price or a day rate. It includes the firm's operating surplus, and what a client pays adds margin, travel and management.
- Personnel costs cover employees only, while value added comes from everyone employed. In Poland 51.8% of persons employed are not employees, which is why we show the employee FTE basis next to the per-person basis.
- Classification differs between countries. France places 104,034 persons in class 62.01 out of 560,858 in division 62.
- 2021 values for six countries carry a break in series. The extrapolation uses only 2022 to 2024: projected share in 2027 = share in 2024 + 3 × (share in 2024 − share in 2022) / 2. It is arithmetic on three published points, not a forecast and not a Eurostat figure.
- The AI figures come from a survey of firms with ten or more persons employed in NACE 62 and 63, a wider group than class 62.01, and count use as yes or no.
The short version
- The Netherlands ranks sixth of 27 in software value added per person employed, €108,440 in 2024 and 34.3% above the EU figure, and its productivity grew faster than its personnel cost since 2021 (22.1% against 17.6%).
- Belgium produces €140,060 of value added per person in software, fourth in the EU, and per unit of output costs 10% less than the Netherlands.
- Dutch software workers produce 14.5% more value added per head than German ones at 3.1% lower personnel cost per employee.
- Polish software personnel cost per employee rose from 49.7% to 63.1% of the Dutch level between 2021 and 2024, and per euro of value added Poland is at best level with the Netherlands.
- AI use in EU software and IT service firms rose from 28.2% to 65.7% between 2021 and 2025, and the countries that use more AI tend to produce more value added per person.
Crux Digits designs and builds AI systems and the software around them for organisations in the Netherlands and Flanders, alongside the customer's ICT partner or internal IT team, and hands over code the customer owns. The data says onshore development is more competitive than hourly figures suggest. For how we approach that work, see custom software development.
Last updated: 28 October 2026.
Software built around your process and data, with AI where it changes the outcome. Something working every week, and the code is yours.
Custom software development in the Netherlands →